CRM Sales Analysis
Description
As part of the Maven Sales Challenge, we are stepping into the
role of a Business Intelligence (BI) Developer for MavenTech, a
leading supplier of computer hardware to large enterprises.
Currently, MavenTech uses a sophisticated Customer Relationship
Management (CRM) system to monitor sales opportunities, but they
lack comprehensive data visibility beyond the CRM.
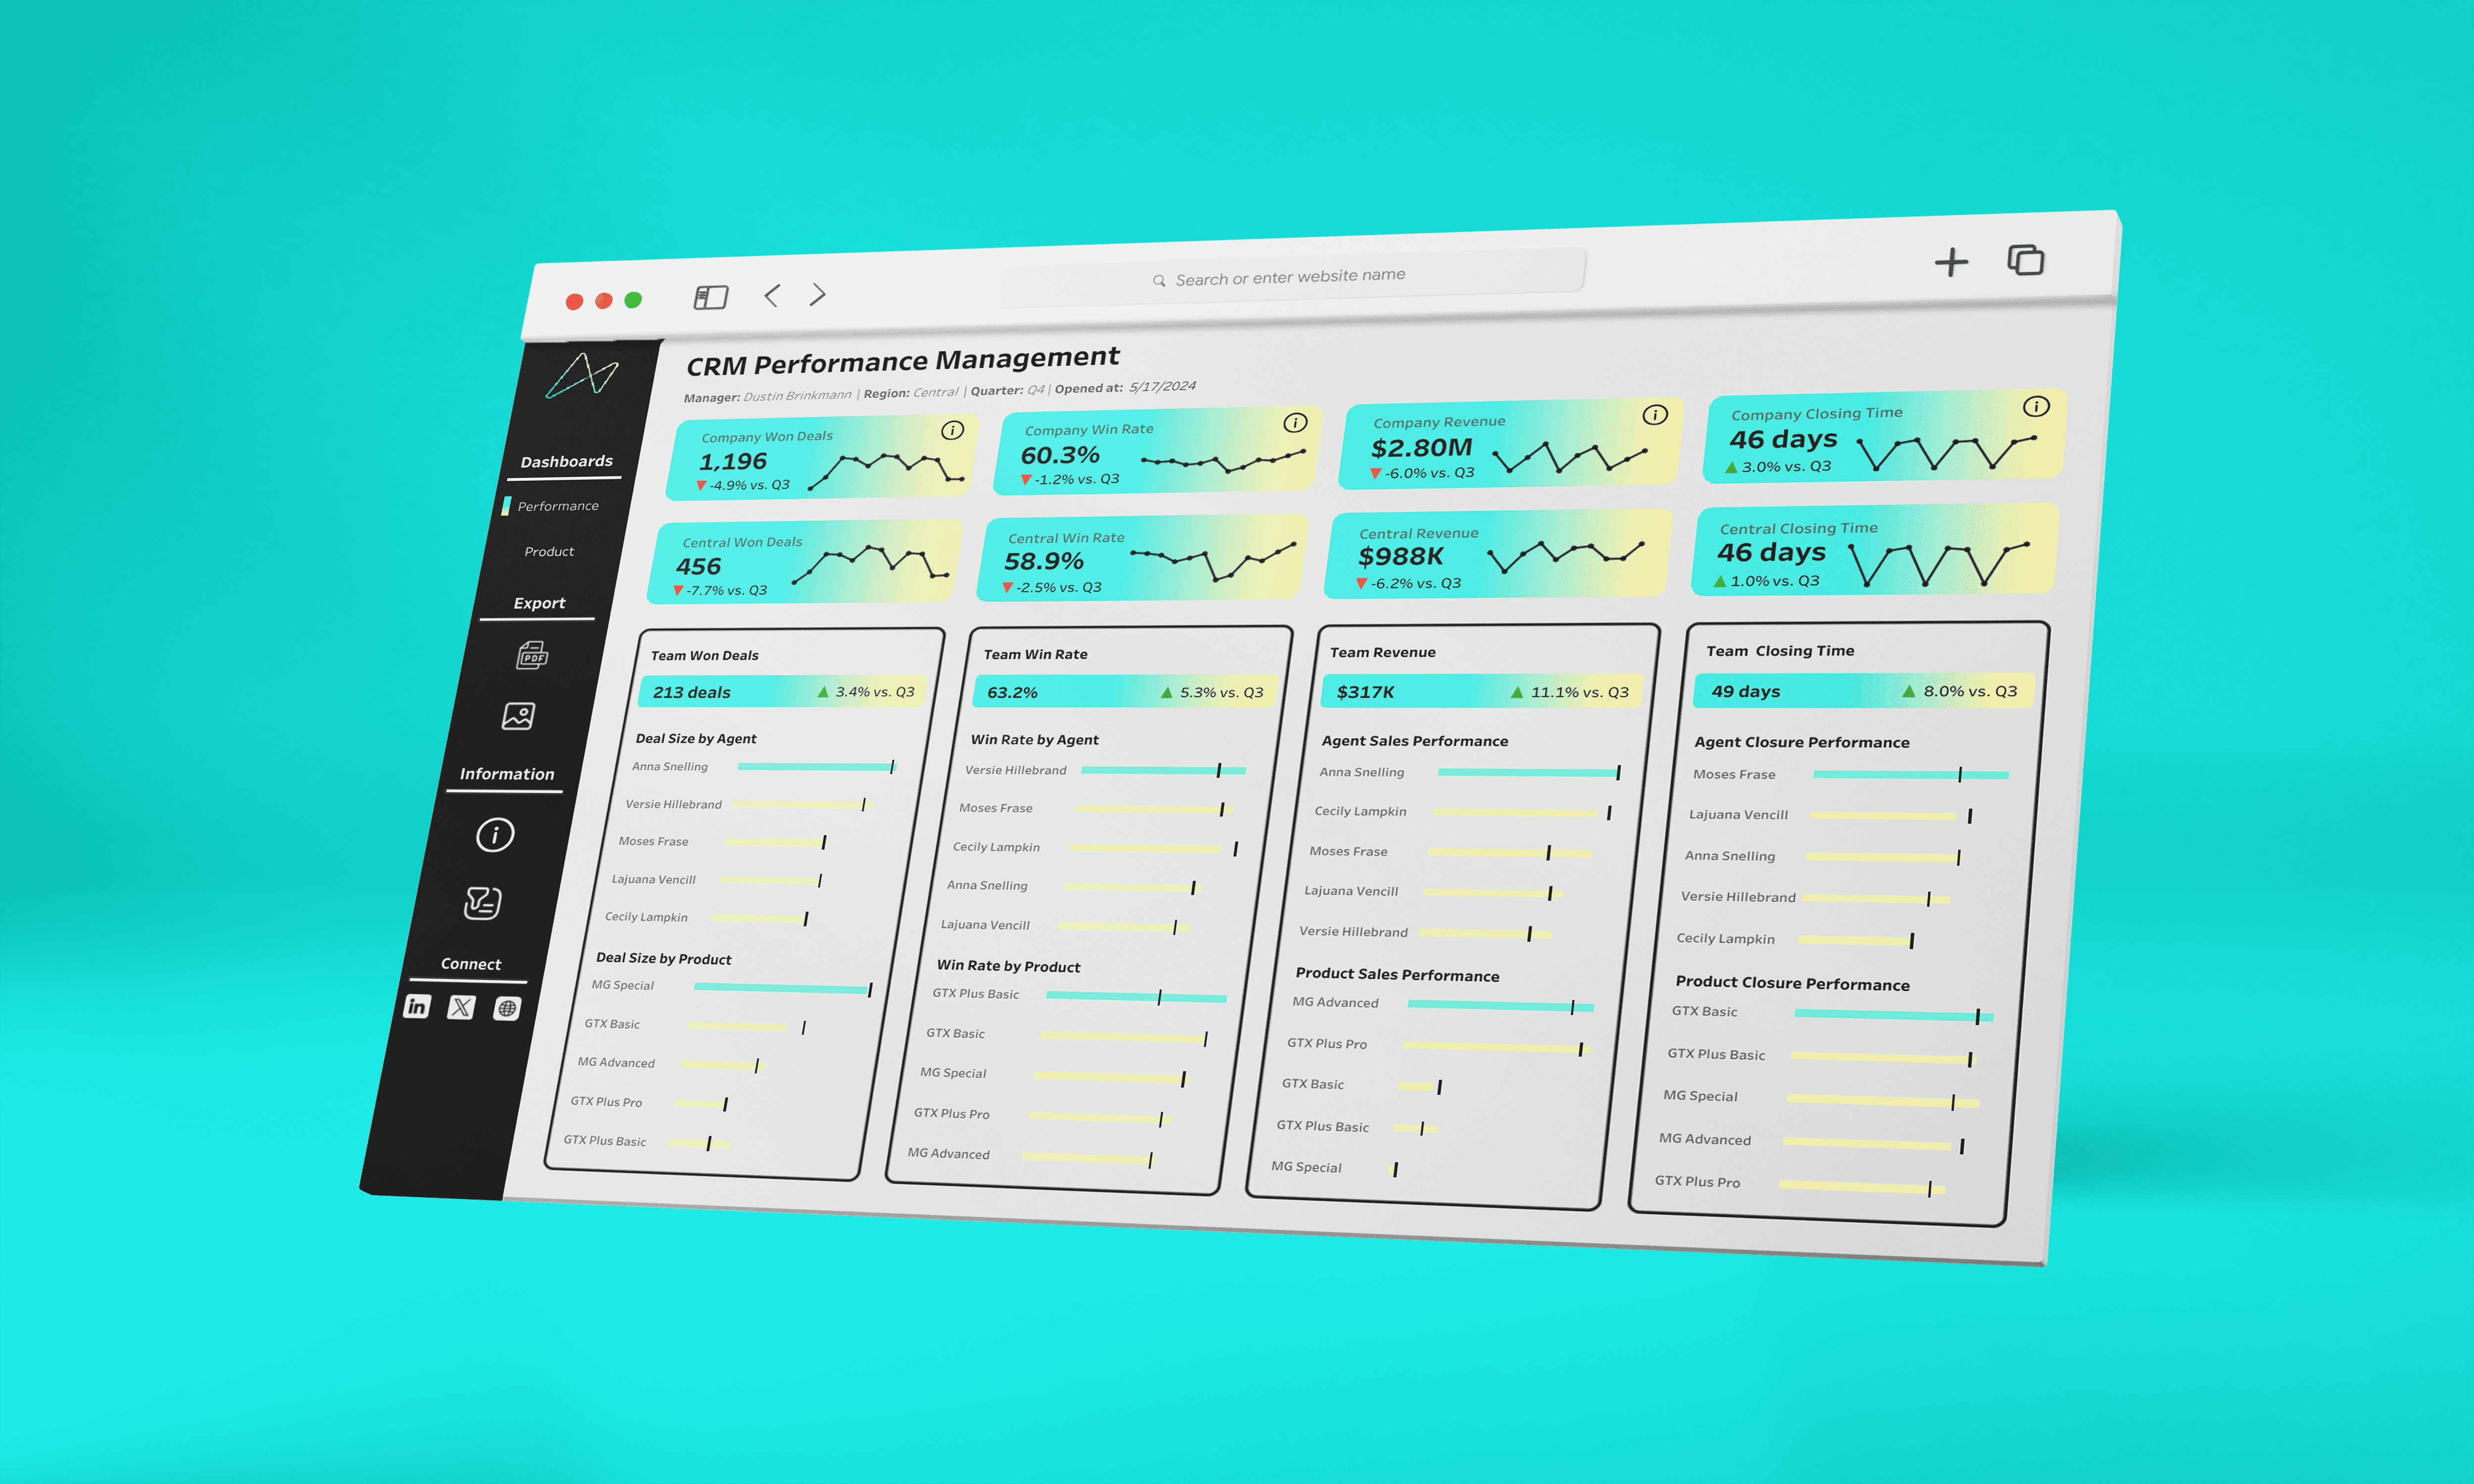
To transform MavenTech into a data-driven
organization, our task is to design an interactive dashboard.
This tool will empower sales managers to effectively monitor
their team's performance on a quarterly basis, providing
valuable insights and driving strategic decisions.
Tools Used
![]() Tableau
Tableau
![]() Figma
Figma
My Role
1- Understanding Requirements:
1.1- Who is the audience?
-
Sales Managers: The key responsibility of sales managers is to supervise sales teams and meet sales objectives. They will serve as the primary users of the dashboard, leveraging it to oversee team performance, monitor goal progression, and enact data-informed strategies.
-
Sales Representatives: Acting as frontline ambassadors, sales agents engage with clients to cultivate sales opportunities. The dashboard enables them to monitor individual performance, track the sales pipeline, and pinpoint areas for enhancement.
1.2- What are their business goals and objectives?
Goals/Objectives:
-
Enhance total sales revenue and profitability.
-
Enhance sales team efficacy and efficiency.
-
Detect and address areas necessitating enhancement and refinement.
Pain Points:
-
limited insight into individual and team achievements.
-
Difficulties in pinpointing and rectifying subpar sales performances.
-
Instant access to crucial performance indicators like revenue, successful deals, and pipeline status.
-
Capability to delve deeper into data, analyzing both individual sales agents and team performances.
Expectations from the Dashboard:
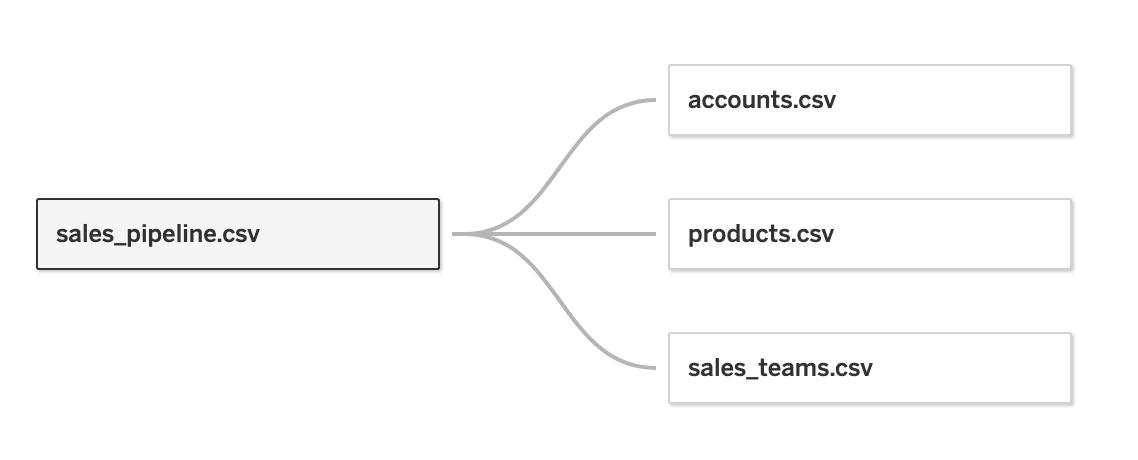
2- Data and Modeling
The dataset comprises a primary fact table containing sales information complemented by three dimension tables including customer account, product, and sales team data. Minimal data cleansing was necessary, and the model's architecture proved to be straightforward and efficient.
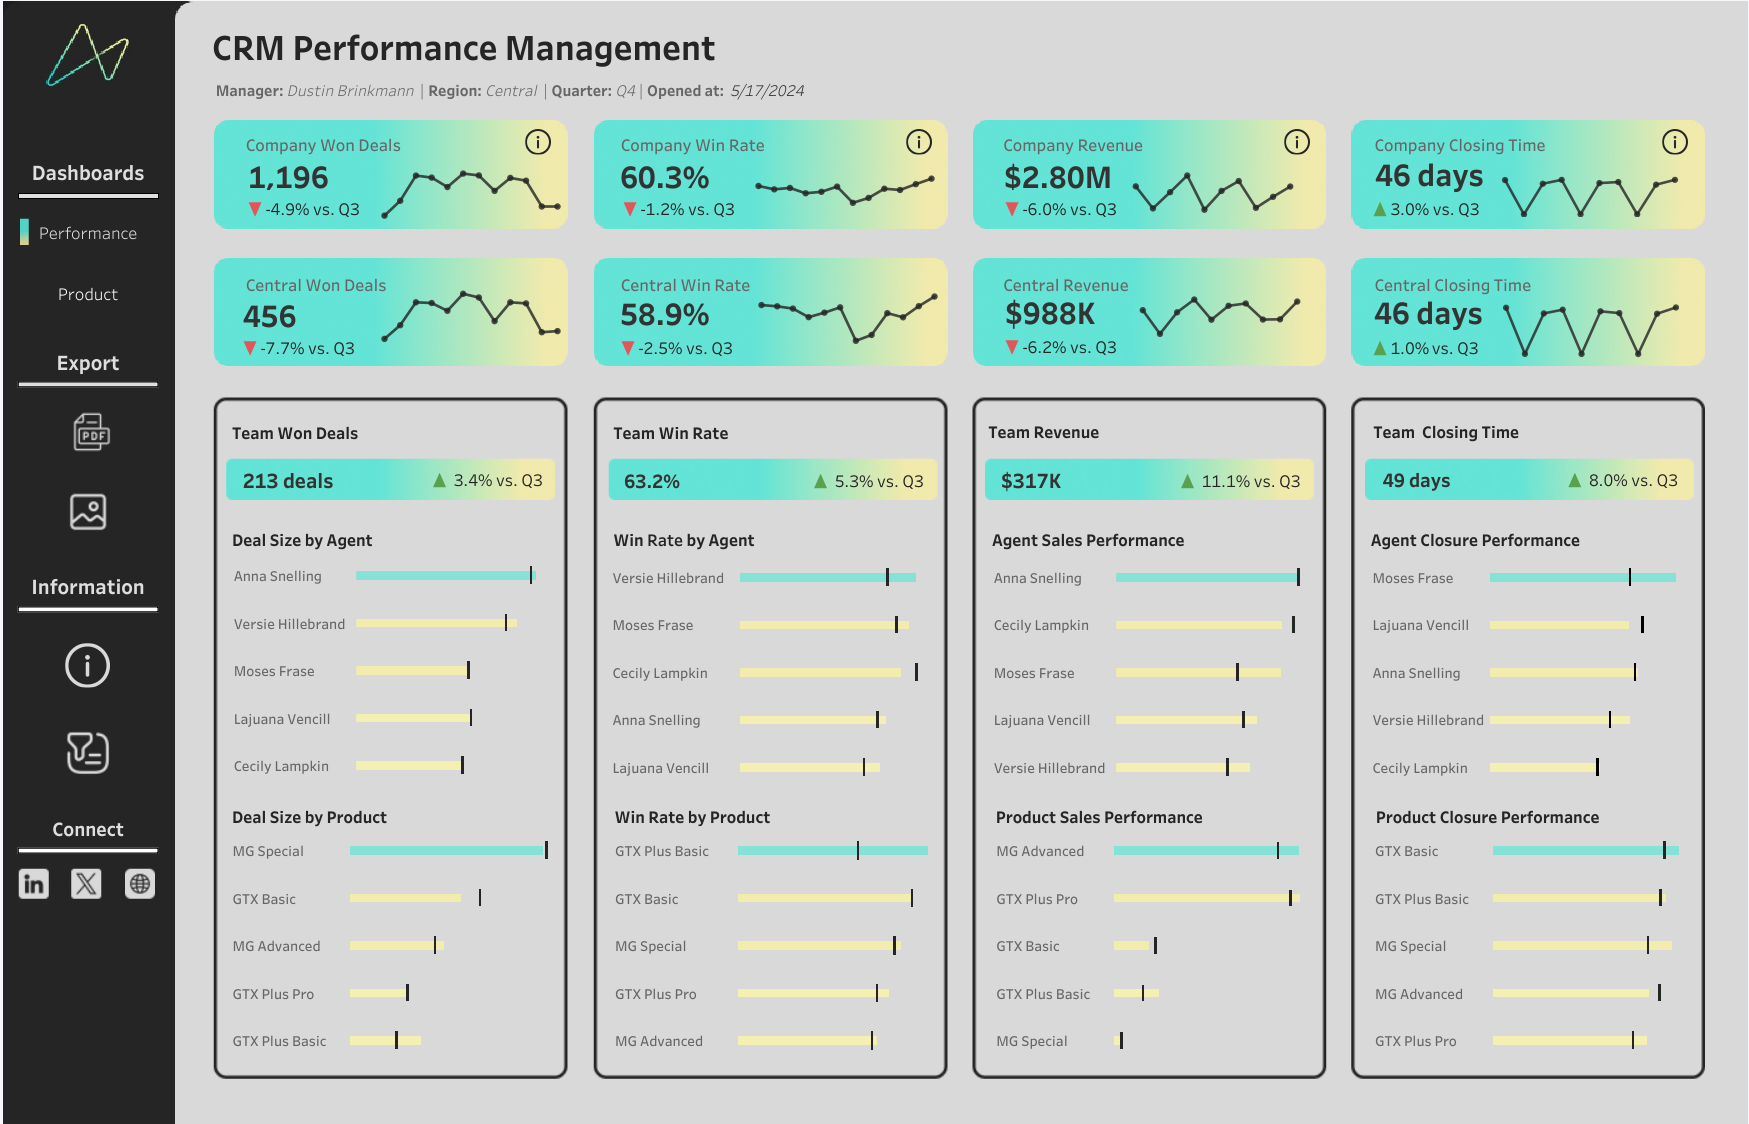
3- Metrics
Drawing from the user story, our selected metrics center on closed deals within the designated quarter, compared against the preceding quarter, offering a comprehensive view across multiple tiers of granularity.
-
Closed Transactions: Quantifies the number of successful deals completed.
-
Success Rate (%): Percentage of successfully closed deals relative to all opportunities.
-
Revenue: Aggregate monetary value ($) generated from successfully closed deals.
-
Average Deal Closure Time: Mean duration (in days) required to finalize a deal.
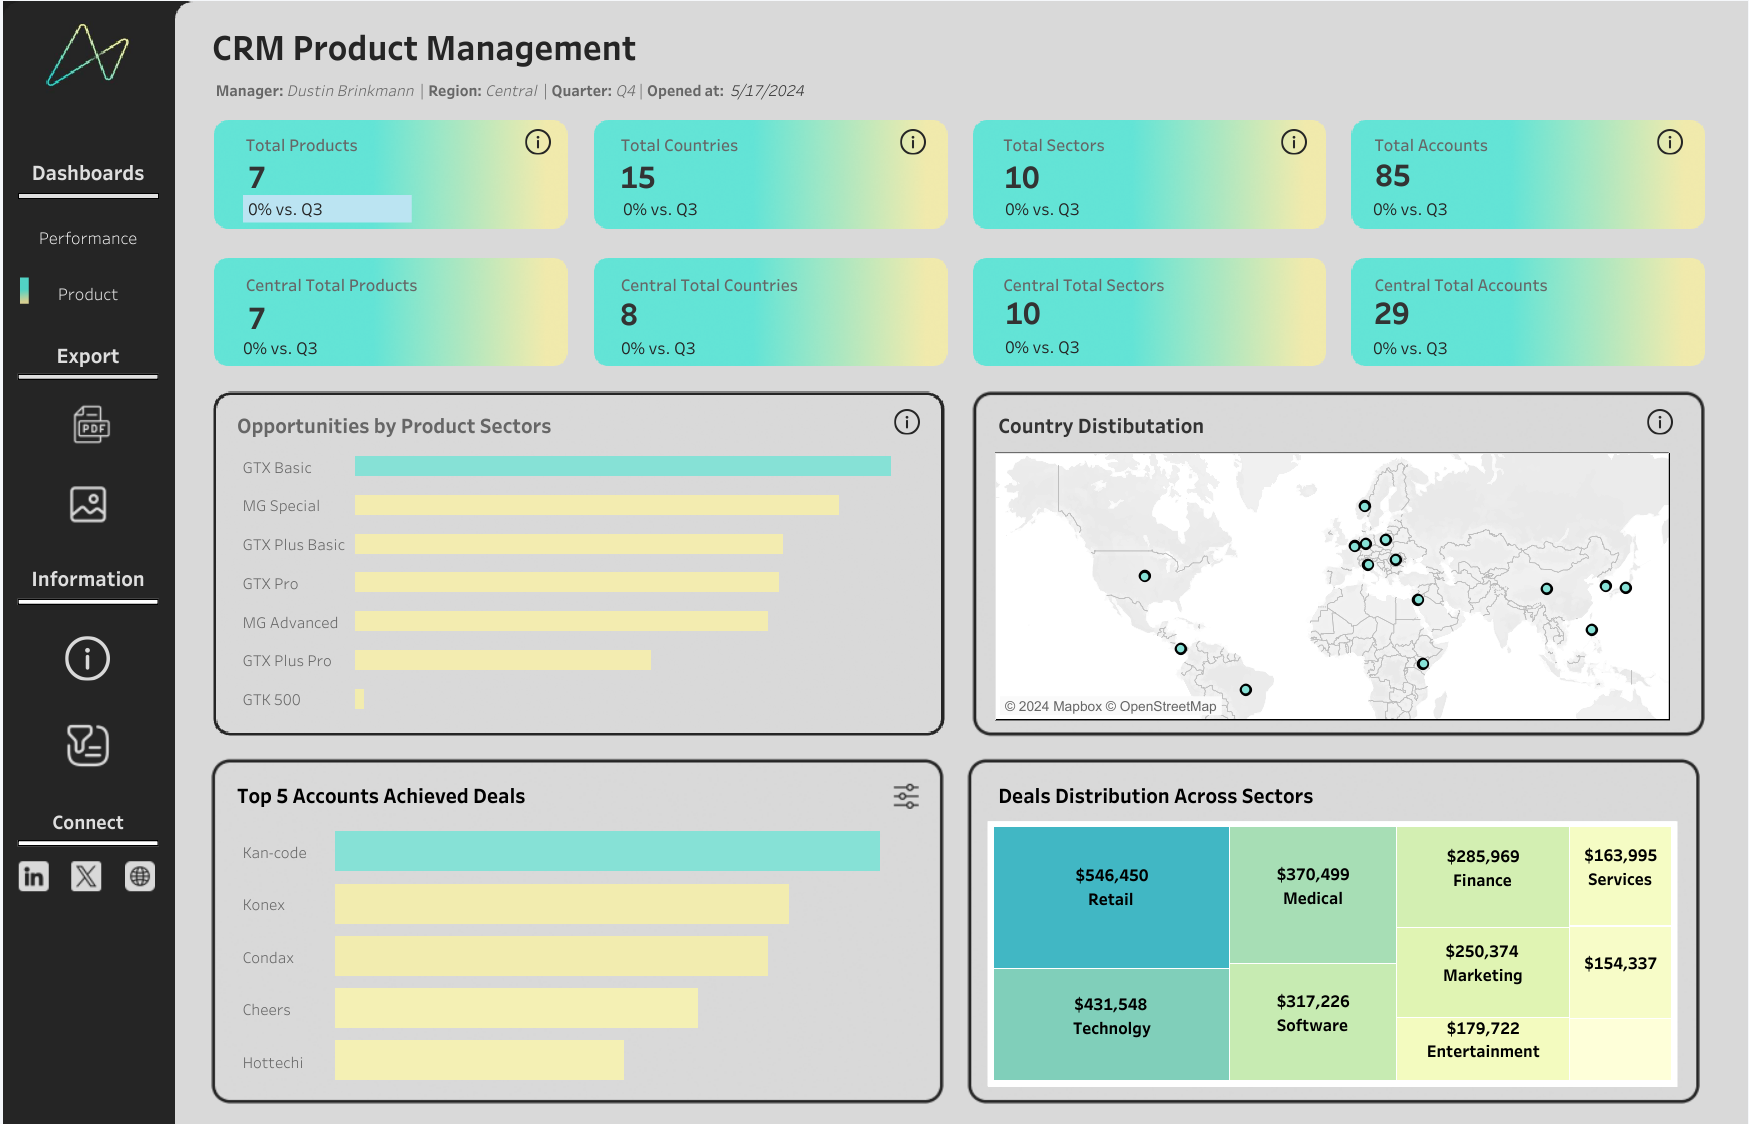
Finally some features I used in the dashboard that you might be interested to know about:
-
I believe that including a message in the custom tooltip, indicating that this visual has a drill-through functionality, can help users better understand how it works and what they need to do to navigate to the detailed page.
-
A dynamic header displaying the manager's name, current quarter, and region, seamlessly adjusting based on the user's filter selection.
-
An interactive parameter designed to display the top-performing accounts, either the top 5 or top 10.